Do you have any idea what is Google Analytics and how does it work? Google Analytics provides tremendous insights into your website’s visitors. However, using it isn’t straightforward, as many beginners find it complex and difficult.
What is Google Analytics?
In simple words, Google Analytics is a free web analytics tool offered by Google to help you analyze your website traffic as well as showing how visitors have interacted with your website.
For further clearance, let’s assume you own a blog. Consequently, you want to know how many users have visited your website. With the assistance of Google Analytics, you can easily see the number of visitors entering your blog. In addition, you can get the information on where they came from, what type of device they used, and other valuable insights.
How does it work?
Google Analytics tracks all of its data by a unique tracking code that you add to every page of your website. The code records diverse activities of users who visited your website. Moreover, other attributes such as age, gender, and the interests of those users are easily available. This collected information will be sent to the Google Analytics server the moment a user exits your website.
Here are some major benefits:
- Analyze your website’s performance.
- Examine to what extent marketing efforts are working.
- What kind of content to create and publish on your website.
- Segment users based on their age, gender, device, etc.
- Optimize website pages to improve conversion rates.
Google Analytics Measurements and Terminology
The blocks of Google Analytics are dimensions and metrics.
Dimensions are the attributes of your data, such as the location where traffic is coming from, the page you’re measuring, or the social media channel you’re estimating.
Metrics are the quantitative measurements of those dimensions. For instance, if you’re looking at how your ads are performing in New York, the 1,000 paid sessions you’ve recorded would be your metric.
Here are some important terms to know:
Users: Number of people visiting your website.
Sessions: A session is the period of time a user is actively engaged with your website, app, etc.
New Users: The number of users who accessed your website during the selected time period.
Pageviews: The total number of pages users visited. Repeated views of the same page are counted.
Bounce Rate: Percentage of single-page sessions in which there is no interaction with the page.
Avg. Session Duration: The average length of sessions.
Conversion Rate: The percentage of sessions that resulted in an e-commerce transaction.
Transactions: Transactions are the total number of completed purchases on your site.
Revenue: The total revenue from web e-commerce or in-app transactions
ROAS: Revenue/Ad Spend.
Here we come to the most essential part!
How to Use Google Analytics?
Create an Account
At any beginning, there might be challenges, and likewise, starting to use Google Analytics might look hard, yet daily hard work eases the process.
The first thing you’ll need to do is to create a Google Analytics account and add the tracking code to your website pages.
Google Analytics Reports
Once you create an account, you’ll immediately be taken to the Google Analytics Home section. This gives you a brief overview of how your website is performing. Simultaneously, you’ll see the reporting tools to use, each one has a specific and particular function.

– Real-Time Reports
Real-time reports are great for measuring the performance of a campaign that you’re running. This feature provides you vital information about the number of current visitors and users. In addition, there are many other tools in the Overview section that will help you to have a broad idea about your website.
– Audience Reports
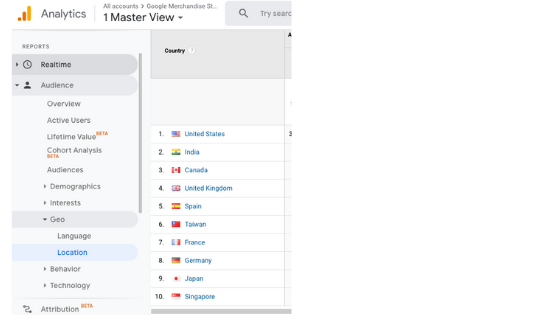
Audience reports hold a very significant role. In case you are interested in knowing the age of your visitors or the device they are using to view your website, you can head over to the Audience section.
– Acquisition Reports
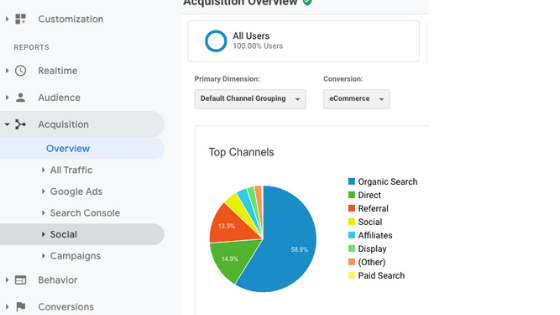
Acquisition refers to the moment of how you get the website traffic. In other words, you can use acquisition reports to see what external sources help you to bring the most traffic to your website. Besides, it allows you to know which search engine is more useful for organic traffic, as well as direct, referral, and social traffic.
– Behavior Reports
Behavior reports are all about seeing what visitors are actually doing on your website. You can learn from what page your visitors entered the website and where did they exit from. Meanwhile, you are able to evaluate the performance of your content and see if your visitors are taking the actions you wish for.
– Conversions Reports
The conversion rate is the percentage of users who implemented the desired action on your website. The desired action is related to your business goal and the marketing strategy as a whole. You can set up different goals you want the users to achieve. Those might be actions like signing up an online form, complete a purchase, or subscribe to your sales list. Remember that it is crucial to enhance the conversion rate if it is low.

In today’s article, we have discussed the main terms and reports in Google Analytics that are available for your use. In conclusion, it is a good time to take a step further and start harnessing its potentials.
Our Earnado team would be happy to provide you any assistance!


